Life Science and Technology News
Biophysics explains how immune cells kill bacteria
A new data analysis technique, moving subtrajectory analysis, designed by researchers at Tokyo Institute of Technology, defines the dynamics and kinetics of key molecules in the immune response to an infection. These biophysical descriptions are expected to clarify the TCR microcluster, an essential assembly for a T cell to initiate its attack on a pathogen.
To kill a pathogen invading the human body, T cells, or lymphocytes, bind to it through T cell receptors (TCR). One of the first events this binding initiates is the formation of a microcluster that includes tens or hundreds of TCR molecules. These microclusters are deemed essential to initiate and sustain the immune signal. A new analysis technique by scientists at School of Life Sciences at Tokyo Institute of Technology provides a quantitative description of the molecules that form these microclusters. The study can be read in Scientific Reports.
"Imaging technologies have visualized the generation and dynamics of microclusters, but there is no quantitative data. We developed 'moving subtrajectory (MST) analysis' using single-molecule tracking to quantitatively study the dynamics and kinetics of CD3 and CD45 around the microcluster," explains Prof. Makio Tokunaga, whose lab designed the new method.
TCR function by forming a complex (TCR/CD3) with CD3. CD45, on the other hand, is not part of the complex, but is believed to regulate the formation of the cluster.
Single molecule imaging was used to trace the movement of CD3 and CD45 around the microclusters. Yuma Ito, an Assistant Professor in the lab, shows that MST analysis is superior to standard analysis methods by revealing details on the temporal and spatial variation of the movement.
"Standard methods analyze the mean square displacement of the whole trajectory. MST divides the trajectory into subtrajectories and calculates the mean square displacement of each subtrajectory. Using MST, we could analyze movement inside, outside and at the boundary of the TCR microclusters," he explains.
The result yields much more data that can be used to parse information about CD3 and CD45 behavior during the creation of TCR microclusters. The researchers found that the dynamics of the two molecules depended on their location relative to the microclusters and could be used to determine their interactions with the microclusters. The kinetics showed CD3 and CD45 could take either a fast or slow mobility state. Inside the microcluster, the slow mobility state was dominant, reflecting stronger interactions between the two molecules and the microcluster. Outside and at the boundary, however, the fast mobility state was dominant. Yet a small fraction of molecules behaved according to the slow mobility state, suggesting that TCR nanoclusters exist at the outside or boundary of the microcluster.
"The appearance of nanoclusters gives us a new understanding of the dynamics of microclusters. The dynamics and kinetics at the single molecule level is very important for defining the molecular mechanisms of biological functions. Along with the new development of biopharmaceuticals related to immune control, elucidation of the mechanism of T cell activation is becoming more important in clinical application. Detailed quantitative data will assist in manufacturing biopharmaceuticals with stronger effects on the immune system," says Tokugawa.
While the paper demonstrates the application of MST analysis to TCR microclusters, the quantitative tool is applicable to any cellular complex that depends on spatiotemporal dynamics, let alone those of the immune system.
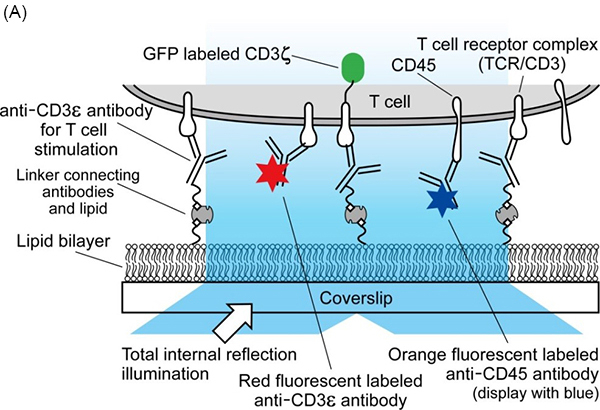
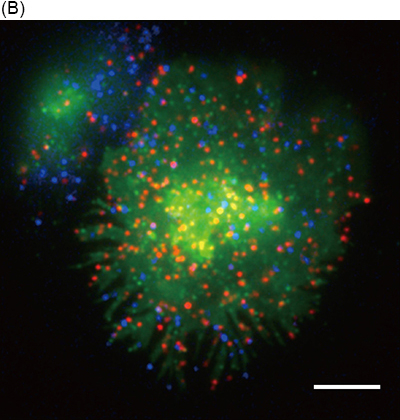
Fig 1. Simultaneous triple-color single-molecule observation using planar lipid bilayers.
(A) Schematic illustration. (B) Representative image of simultaneous three-color single-molecule observation of CD3ζ-EGFP (green), Qdot 655-labeled CD3ε (red), and Qdot 585-labeled CD45 (blue) in living Jurkat cells at 37℃. Bar, 5 μm.
Reference
| Authors | Yuma Ito1, Kumiko Sakata-Sogawa1, Makio Tokunaga1 |
|---|---|
| Title of original paper | Multi-color single-molecule tracking and subtrajectory analysis for quantification of spatiotemporal dynamics and kinetics upon T cell activation |
| Journal | Scientific Reports |
| DOI | 10.1038/s41598-017-06960-z |
| Affiliations | Department of Life Science and Technology, School of Life Science and Technology, Tokyo Institute of Technology |
- Labs spotlight #15 - Tokunaga and Sogawa Laboratory
- Researcher Profile | Tokyo Tech STAR Search - Makio Tokunaga
- Researcher Profile | Tokyo Tech STAR Search - Yuma Ito
- Latest Research News

School of Life Science and Technology
—Unravel the Complex and Diverse Phenomena of Life—
Information on School of Life Science and Technology inaugurated in April 2016
Further information
Professor Makio Tokunaga
School of Life Science and Technology
Email mtoku@bio.titech.ac.jp
Tel +81-45-924-5711
Featured News

![]()